本文最后更新于 277 天前,如有错误请邮件至 zhiligyi222na@gmail.com
可以统计的数据举例
- 统计不同分类下用户发布文章的数量
- 统计不同用户发布文章的数量
- 统计最近一周每天平台用户发布的文章数量(每天的活跃度)
echarts官网
echarts的使用
安装依赖
cd vue
npm install echarts --save
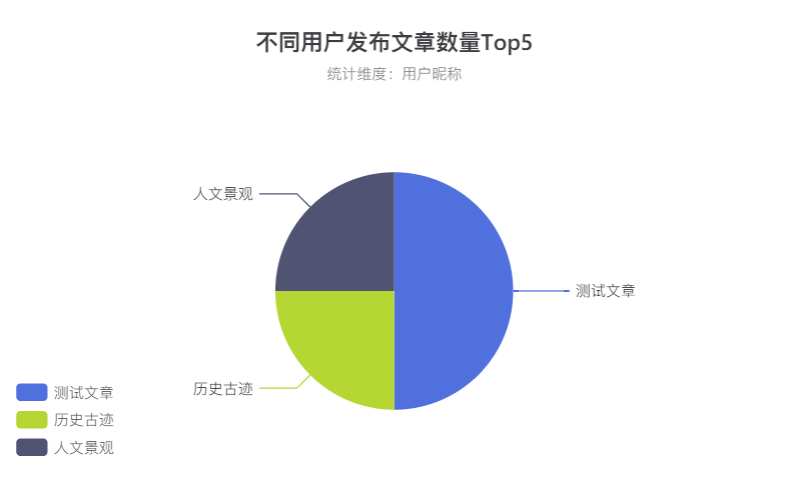
import * as echarts from "echarts";饼图的实现代码
//饼图
let pieOptions = {
  title: {
    text: '不同用户发布文章数量Top5', //主标题
    subtext: '统计维度:用户昵称', //副标题
    left: 'center'
  },
  tooltip: {
    trigger: 'item',
    formatter: '{a} <br/>{b} : {c} ({d}%)'
  },
  legend: {
    orient: 'vertical',
    left: 'left'
  },
  series: [
    {
      name: '数量占比', //鼠标移上去显示内容
      type: 'pie',
      radius: '50%',
      center: ['50%', '60%'],
      data: [
        { value: 1048, name: '测试文章' },
        { value: 735, name: '历史古迹' },
        { value: 580, name: '人文景观' }
      ],
      emphasis: {
        itemStyle: {
          shadowBlur: 10,
          shadowOffsetX: 0,
          shadowColor: 'rgba(0, 0, 0, 0.5)'
        }
      }
    }
  ]
};
统计图的数据结构
饼图:
data: [
        { value: 1048, name: '测试文章' },
        { value: 735, name: '历史古迹' },
        { value: 580, name: '人文景观' },
      ],
前端:[ ] 表示一个数组(对应多条数据),{ } 表示一个对象(对应一条数据),
对应的后端:List(对应多条数据),某个对象或者是Map<key, value>
后端List<Xxx>或者List<Map<key, value>>
后台接口封装该数据结构所需要的数据
EchartsController.java
package org.example.springdemo.controller;

import jakarta.annotation.Resource;
import org.example.springdemo.common.Result;
import org.example.springdemo.entity.Article;
import org.example.springdemo.entity.Category;
import org.example.springdemo.service.ArticleService;
import org.example.springdemo.service.CategoryService;
import org.springframework.web.bind.annotation.RequestMapping;
import org.springframework.web.bind.annotation.RestController;

import java.util.ArrayList;
import java.util.HashMap;
import java.util.List;
import java.util.Map;

@RestController
@RequestMapping("/echarts")
public class EchartsController {

    @Resource
    public CategoryService categoryService;
    @Resource
    public ArticleService articleService;

    @GetMapping("pie")("pie")
    public Result pie() {
        List<Map<String, Object>> list = new ArrayList<>();
        // 查询出所有的分类信息
        List<Category> categories = categoryService.selectAll(new Category());
        // 查询出所有的文章信息
        List<Article> articles = articleService.selectAll(new Article());
        for (Category category : categories) {
            long count = articles.stream().filter(x -> category.getId().equals(x.getCategoryId())).count();
            Map<String, Object> map = new HashMap<>();
            map.put("name", category.getTitle());
            map.put("value", count);
            list.add(map);
        }
        return Result.success(list);
    }
}
前端渲染
const loadPie = () => {
  request.get('/echarts/pie').then(res => {
    if (res.code === '200') {
      let chartDom = document.getElementById('pie');
      let myChart = echarts.init(chartDom)
      pieOptions.series[0].data = res.data
      myChart.setOption(pieOptions)
    }
  })
}
onMounted(() => {
  loadPie()
})
完成结果
完整数据结构
//饼图
let pieOptions = {
  title: {
    text: '不同用户发布文章数量Top5', //主标题
    subtext: '统计维度:用户昵称', //副标题
    left: 'center'
  },
  grid : {
    top : '20%',
    bottom : '20%',
  },
  tooltip: {
    trigger: 'item',
    formatter: '{a} <br/>{b} : {c} ({d}%)'
  },
  legend: {
    orient: 'vertical',
    left: 'left'
  },
  series: [
    {
      name: '数量占比', //鼠标移上去显示内容
      type: 'pie',
      radius: '50%',
      center: ['50%', '60%'],
      data: [
        { value: 1048, name: '测试文章' },
        { value: 735, name: '历史古迹' },
        { value: 580, name: '人文景观' }
      ],
      emphasis: {
        itemStyle: {
          shadowBlur: 10,
          shadowOffsetX: 0,
          shadowColor: 'rgba(0, 0, 0, 0.5)'
        }
      }
    }
  ]
};

// 柱状图
let barOptions = {
  title: {
    text: '不同用户发布文章的数量Top5',
    subtext: '统计维度:用户昵称',
    left: 'center'
  },
  xAxis: {
    type: 'category',
    data: ['Mon', 'Tue', 'Wed', 'Thu', 'Fri', 'Sat', 'Sun'],
    name: '用户昵称'
  },
  yAxis: {
    type: 'value',
    name: '文章数量'
  },
  tooltip: {
    trigger: 'item',
  },
  series: [
    {
      data: [120, 200, 150, 80, 70, 110, 130],
      type: 'bar',
      itemStyle: {
        normal: {
          color: function () {
            return "#" + Math.floor(Math.random() * (256 * 256 * 256 - 1)).toString(16);
          }
        },
      },
      backgroundStyle: {
        color: 'rgba(180, 180, 180, 0.2)'
      }
    }
  ]
};

//折线图
let lineOptions = {
  title: {
    text: '最近一周文章发布数量',
    subtext: '统计维度:最近一周',
    left: 'center'
  },
  legend: {
    data: [],
    template:""
  },
  grid: {
    left: '3%',
    right: '4%',
    bottom: '3%',
    containLabel: true
  },
  tooltip: {
    trigger: 'item'
  },
  xAxis: {
    name: '日期',
    type: 'category',
    data: ['Mon', 'Tue', 'Wed', 'Thu', 'Fri', 'Sat', 'Sun']
  },
  yAxis: {
    name: '文章数量',
    type: 'value'
  },
  series: [
    {
      name: '文章数量',
      data: [820, 932, 901, 934, 1290, 1330, 1320],
      type: 'line',
      smooth: true,
      markLine: {
        data: [{ type: 'average', name: '最近一周文章发布数量平均值' }]
      },
      markPoint: {
        data: [
          { type: 'max', name: '最大值' },
          { type: 'min', name: '最小值' }
        ]
      },
    },
  ]
};
完整后端接口
package org.example.springdemo.controller;

import cn.hutool.core.date.DateField;
import cn.hutool.core.date.DateTime;
import cn.hutool.core.date.DateUtil;
import cn.hutool.core.util.ObjectUtil;
import jakarta.annotation.Resource;
import org.example.springdemo.common.Result;
import org.example.springdemo.entity.Article;
import org.example.springdemo.entity.Category;
import org.example.springdemo.entity.User;
import org.example.springdemo.service.ArticleService;
import org.example.springdemo.service.CategoryService;
import org.example.springdemo.service.UserService;
import org.springframework.web.bind.annotation.GetMapping;
import org.springframework.web.bind.annotation.RequestMapping;
import org.springframework.web.bind.annotation.RestController;

import java.util.*;
import java.util.stream.Collectors;

@RestController
@RequestMapping("/echarts")
public class EchartsController {

    @Resource
    public CategoryService categoryService;
    @Resource
    public ArticleService articleService;
    @Resource
    public UserService userService;

    @GetMapping("/pie")
    public Result pie() {
        List<Map<String, Object>> list = new ArrayList<>();
        // 查询出所有的分类信息
        List<Category> categories = categoryService.selectAll(new Category());
        // 查询出所有的文章信息
        List<Article> articles = articleService.selectAll(new Article());
        for (Category category : categories) {
            long count = articles.stream().filter(x -> category.getId().equals(x.getCategoryId())).count();
            Map<String, Object> map = new HashMap<>();
            map.put("name", category.getTitle());
            map.put("value", count);
            list.add(map);
        }
        return Result.success(list);
    }

    @GetMapping("/bar")
    public Result bar() {
        Map<String, Object> resultMap = new HashMap<>();
        List<String> xList = new ArrayList<>();
        List<Long> yList = new ArrayList<>();
        Map<String, Long> map = new HashMap<>();

        // 查询所有的用户
        List<User> users = userService.selectAll(new User());
        // 查询出所有的文章信息
        List<Article> articles = articleService.selectAll(new Article());
        for (User user : users) {
            long count = articles.stream().filter(x -> user.getId().equals(x.getUserId())).count();
            map.put(user.getName(), count);
        }

        //对map进行排序,按照value来倒序
        LinkedHashMap<String, Long> collectMap = map.entrySet().stream()
                .sorted(Collections.reverseOrder(Map.Entry.comparingByValue()))
                .collect(Collectors.toMap(Map.Entry::getKey, Map.Entry::getValue, (e1, e2) -> e1, LinkedHashMap::new));

        for (String key : collectMap.keySet()) {
            xList.add(key);
            yList.add(collectMap.get(key));
        }

        //top前5
        if (xList.size() > 5 && yList.size() > 5) {
            xList = xList.subList(0, 5);
            yList = yList.subList(0, 5);
        }

        resultMap.put("xAxis", xList);
        resultMap.put("yAxis", yList);
        return Result.success(resultMap);
    }

    @GetMapping("/line")
    public Result line() {
        Map<String, Object> resultMap = new HashMap<>();
        List<Long> yList = new ArrayList<>();

        // 获取最近多少天的年月日List
        Date today = new Date();
        DateTime start = DateUtil.offsetDay(today, -7);
        List<String> xList = DateUtil.rangeToList(start, today, DateField.DAY_OF_YEAR).stream().map(DateUtil::formatDate).toList();

        // 查询出所有的文章信息
        List<Article> articles = articleService.selectAll(new Article());

        for (String day : xList) {
            long count = articles.stream().filter(x -> ObjectUtil.isNotEmpty(x.getTime()) && x.getTime().contains(day)).count();
            yList.add(count);
        }

        resultMap.put("xAxis", xList);
        resultMap.put("yAxis", yList);
        return Result.success(resultMap);
    }
}